| CAS NO: | 1346704-33-3 |
| 规格: | ≥98% |
| 包装 | 价格(元) |
| 50mg | 电议 |
| 100mg | 电议 |
| 250mg | 电议 |
| 500mg | 电议 |
| Molecular Weight (MW) | 541.69 |
|---|---|
| Formula | C31H39N7O2 |
| CAS No. | 1346704-33-3 |
| Storage | -20℃ for 3 years in powder form |
| -80℃ for 2 years in solvent | |
| Solubility (In vitro) | DMSO: 10 mg/mL (18.5 mM) |
| Water: <1 mg/mL | |
| Ethanol: 4 mg/mL (7.4 mM) | |
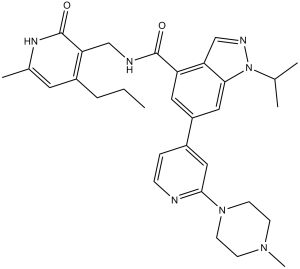
| SMILES | O=C(C1=CC(C2=CC(N3CCN(C)CC3)=NC=C2)=CC4=C1C=NN4C(C)C)NCC5=C(CCC)C=C(C)NC5=O |
| Synonyms | GSK-343; GSK 343; GSK343 Chemical Name: 1-isopropyl-N-((6-methyl-2-oxo-4-propyl-1,2-dihydropyridin-3-yl)methyl)-6-(2-(4-methylpiperazin-1-yl)pyridin-4-yl)-1H-indazole-4-carboxamide. InChi Key: ULNXAWLQFZMIHX-UHFFFAOYSA-N InChi Code: InChI=1S/C31H39N7O2/c1-6-7-23-14-21(4)35-31(40)26(23)18-33-30(39)25-15-24(16-28-27(25)19-34-38(28)20(2)3)22-8-9-32-29(17-22)37-12-10-36(5)11-13-37/h8-9,14-17,19-20H,6-7,10-13,18H2,1-5H3,(H,33,39)(H,35,40) SMILES Code: O=C(C1=CC(C2=CC(N3CCN(C)CC3)=NC=C2)=CC4=C1C=NN4C(C)C)NCC5=C(CCC)C=C(C)NC5=O |
| In Vitro | In vitro activity: GSK343 inhibits trimethylation of H3K27 (H3K27me3) with IC50 of 174 nM in HCC1806 breast cancer cells. GSK343 potently inhibits cell proliferation in breast cancer cells and prostate cancer cells, and the prostate cancer cell line LNCaP is the most sensitive to GSK343, with IC50 of 2.9 μM. GSK343 significantly suppresses the growth of EOC cells cultured in 3D matrigel extracellular matrix (ECM), which mimics the tumor microenvironment in vivo. In addition, GSK343 also induces apoptosis of EOC cells in 3D and significantly inhibits the invasion of EOC cells. Kinase Assay: Activity against EZH2 was assessed using 5 member PRC2 complex (Flag-EZH2, EED, SUZ12, AEBP2 and RbAp48). The assay protocol may be summarized as follows: 10 mM stocks of compounds were prepared from solid in 100% DMSO. An 11 point serial dilution master plate was prepared in 384 well format (1:3 dilution, columns 6 and 18 were equal volume DMSO controls) and dispensed to assay ready plates using acoustic dispensing technology to create a 100 nL stamp of compound and DMSO controls. The assay additions consisted of equal volume additions of 10 nM EZH2 and the substrate solution (5 ?g/mL HeLa nucleosomes and 0.25 ?M [3H]-SAM) dispensed into assay plates using a multi-drop combi dispense. Reaction plates were incubated for 1 hr and quenched with an equal volume addition of 0.5 mg/mL PS-PEI Imaging Beads (RPNQ0098) containing 0.1 mM unlabeled SAM. The plates were sealed, dark adapted for 30 mins, and a 5-min endpoint luminescence image was acquired using a Viewlux imager. Plate statistics such as Z’ and signal to background as well as dose response curves were analyzed using Activity BaseXE. The in vitro biochemical activity of EZH1 was assessed as part of a 5 member PRC2 complex using a 384 well SPA assay identical to EZH2. Buffer components, reagent dispensing, compound plate preparation, quench conditions and data analysis were identical for EZH1 and EZH2 with final assay concentrations of 20 nM EZH1, 5 μM/mL HeLa nucleosomes and 0.25 μM [3H]-SAM. Further data analysis, pIC50 pivots and visualizations were enabled by TIBCO Spotfire. Compounds were profiled at Reaction Biology Corp. (Malvern, PA) to assess inhibition in their panel of histone methyltransferase assays. Methyltransferase activity was assessed using HotSpot technology, a miniaturized radioisotope-based filter binding assay. Inhibitors were dissolved in dimethyl sulfoxide (DMSO) and tested at concentrations up to 100 μM with a final DMSO concentration of 2%. Buffer containing the methyltrasferase at the listed concentration and its preferred substrate as shown in the accompanying table was preincubated with compound for 10 mins. Reactions were initiated by the addition of 1 μM S-adenosyl-L-[methyl-3H]methionine (SAM), allowed to incubate for 60 mins at 30℃ followed by transfer to P81 filter-paper and PBS wash before detection. Cell Assay: To account for varying doubling rates among cancer cell lines (Breast cancer cell lines (HCC1806, Sk-Br-3, ZR-75-1), prostate cancer cell lines (DU145, PC3, LNCaP)), the optimal cell seeding is determined empirically for all cell lines by examining their growth in a 384-well plate over 6 days with a wide range of seeding densities. Cells are then plated at the optimal seeding density and allowed to adhere overnight. Cells are treated in duplicate with a 20-point 2-fold dilution series of compound or 0.147% DMSO (vehicle control) and incubated for 6 days at 37C in 5% CO2. Cells are then lysed with 25 μl CellTiter-Glo per well and chemiluminescence is quantified with a TECAN Safire2 microplate reader. In addition, an untreated plate of cells is harvested at the time of compound addition (T0) to quantify the starting number of cells. CTG values after 6 days of treatment were expressed as a percent of the T0 value and plotted against compound concentration. Data are fit with a 4-parameter equation to generate a concentration response curve and the concentration of compound required to inhibit 50% of growth (gIC50) is determined |
|---|---|
| In Vivo | Compare with the controls, GSK343 (5 mg/kg)-treated mice exhibits significantly inhibited tumor growth. The average tumor volume and weight of the GSK343-treated cohort is remarkably reduced. As early as 20 days post-implantation, a significant reduction in tumor growth is observed in the GSK343-treated cohort relative to the control cohort; this difference persisted through the remainder of the study. In addition, compare with the control cohort, the GSK343-treated animals in the xenograft model show a remarkable increase in messenger RNA levels of E-cadherin but a significant decrease in vimentin messenger RNA levels |
| Animal model | Mice |
| Formulation & Dosage | 5 mg/kg |
| References | ACS Med Chem Lett. 2012, 3, 1091-1096; Cell Cycle. 2013 Jul 1;12(13):2113-9. |
 m.cnreagent.com